
PLG Stack (Promtail + Loki + Grafana)
Grafana팀에서 구축한 Loki는 Prometheus에서 많은 영감을 받은 확장 가능한 로그 집계 시스템으로, 운영 및 리소스 할당이 용이해 인기를 얻고 있다.
EFK vs PLG 참고
loki vs elasticsearch

Promtail
- Loki를 위해 설계된 수집기
- 로그 데이터 수집 및 Loki로 전달
- DaemonSet 으로 배포되어 특정 노드의 모든 컨테이너에서 주기적으로 로그를 읽는다. (stdout, stderr 로그)
- Promtail은 로그 스트림을 localize 하고 읽는 것 외에도, Loki로 로그를 push하기 전에 label을 붙일 수 있다.
Loki
- 로그에 최적화된 데이터 저장소
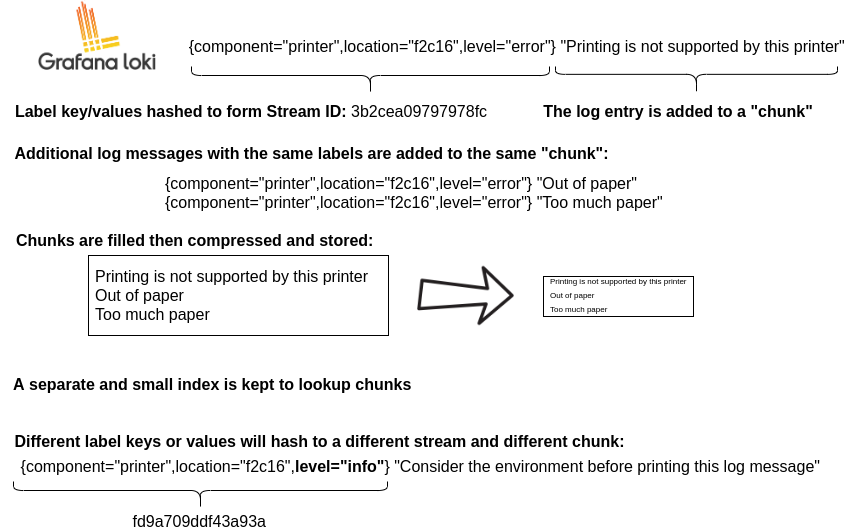
- 다른 log aggregation 시스템과 다르게, 로그 메시지 자체를 인덱싱하지 않는다. 모든 로그에 할당된 레이블을 인덱싱한다.
- https://grafana.com/oss/loki/
- LogQL을 사용해 Loki에 저장된 로그 쿼리 가능
Grafana
- Loki에 저장된 로그를 시각화하는 대시보드
- Loki와 Grafana는 통합이 잘 되어 있으며, 어플리케이션 로그 및 해당 로그에서 계산된 메트릭을 기반으로 grafana에서 개별 대시보드를 구축할 수 있다.
- 원래 시계열 데이터를 시각화하기 위해 만들어짐
Loki Components
https://grafana.com/docs/loki/latest/fundamentals/architecture/components/

Distributor
- Distributor는 Loki에서 가장 먼저 데이터를 수신하는 역할
- Distributor는 로그 데이터를 수신하여 최적의 방식으로 Ingester에 전달하며, 이를 통해 로그 데이터의 분산 처리를 효율적으로 수행
Ingester
- Ingester는 Distributor로부터 수신한 로그 데이터를 저장하는 역할
- 로그 데이터를 수신하고, 해당 데이터를 블록 단위로 분할하여 백업 스토리지에 저장
- 로그 스트림을 메모리에 chunk 단위로 저장하고, 일정 간격으로 백업 스토리지로 플러시
- ingester에 충돌이 발생하면, 플러시되지 않은 데이터가 손실될 수 있음
Querier
- Querier는 사용자가 요청한 데이터를 수집하고, 검색 쿼리에 따라 로그 데이터를 필터링
Read Path (데이터 쿼리) 과정
https://grafana.com/docs/loki/latest/fundamentals/architecture/
- querier는 데이터에 대한 HTTP/1 request를 받는다.
- querier는 메모리 내 데이터에 대한 모든 ingester에 쿼리를 전달한다.
- ingester들은 read request를 받고, 쿼리와 일치하는 데이터가 있으면 반환한다.
- querier는 지원 저장소에서 데이터를 lazy load하고, ingester들이 데이터를 반환하지 못하면 이에 대해 쿼리를 수행한다.
- querier는 받은 모든 데이터를 돌아 중복 제거하고, HTTP/1 연결을 통해 최종 데이터를 반환한다.
Write Path (데이터 저장) 과정
- distributor는 스트림 데이터를 저장하라는 HTTP/1 요청을 받는다.
- 각 스트림은 hash ring을 사용하여 해시된다.
- distributor는 각 스트림을 적절한 ingester와 그의 replica들에게 전송한다.
- 각 ingester는 청크를 생성하거나, 기존 스트림 데이터 청크에 추가한다. 청크는 테넌트 및 레이블셋별로 유니크하다.
- distributor는 HTTP/1 연결을 통해 success code를 반환한다.
Helm으로 PLG Stack 설치
Grafana helm charts
https://github.com/grafana/helm-charts/tree/main/charts/loki-stack
$ helm repo add grafana https://grafana.github.io/helm-charts
$ helm repo update

# grafana 활성화하여 설치 (loki + promtail + grafana)
# grafana 최신 이미지 적용 (낮은 버전은 쿼리 지원이 잘 안된다.)
$ helm install loki grafana/loki-stack --set grafana.enabled=true --set grafana.image.tag=9.4.3

# grafana admin password 확인
$ kubectl get secret --namespace <YOUR-NAMESPACE> loki-grafana -o jsonpath="{.data.admin-password}" | base64 --decode ; echo
Grafana의 values.yaml 값을 변경하여 계정 설정을 할 수 있다.
# grafana values.yaml

adminUser: admin
adminPassword: strongpasswordGrafana 서비스를 편한 방식으로 외부로 노출시켜 대시보드를 확인한다. (여기서는 NodePort 사용)
loki-stack을 통해 설치하면 Grafana에 loki 서비스가 자동으로 등록되어 있으므로 바로 사용할 수 있다.
Loki Storage 설정
https://grafana.com/docs/loki/latest/operations/storage/
다른 로깅 시스템과 달리 Grafana Loki는 로그에 대한 메타데이터만 인덱싱한다는 아이디어, 즉 레이블(Prometheus 레이블과 같음)을 중심으로 구축되었다.

로그 데이터 자체는 압축되어 S3 또는 GCS와 같은 object storage 또는 filesystem의 local에 chuck로 저장된다. 각 로그 스트림에 대해 일련의 레이블만 인덱싱되므로 생성되는 인덱스가 작다. 작은 인덱스와 고도로 압축된 chunck는 작업을 단순화하고 비용을 크게 낮춘다.
인덱스 파일은 로그 데이터의 메타데이터를 저장한다. 말그대로 검색을 위한 색인 역할을 한다. 따라서 loki가 저장하는 관리하는 데이터를 확인해보면 index과 chunk를 확인할 수 있다.
loki가 데이터를 filesystem이 아닌 object storage에 저장하도록 해보자.
loki-stack의 values.yaml 에 다음과 같이 config를 추가한다. (loki-stack 내 dependency chart loki 를 참고한다.)
loki:
  enabled: true
  isDefault: true
  url: http://{{(include "loki.serviceName" .)}}:{{ .Values.loki.service.port }}
  readinessProbe:
    httpGet:
      path: /ready
      port: http-metrics
    initialDelaySeconds: 45
  livenessProbe:
    httpGet:
      path: /ready
      port: http-metrics
    initialDelaySeconds: 45
  datasource:
    jsonData: "{}"
    uid: ""
  config: # set loki storage
    schema_config:
      configs:
      - from: 2023-01-24
        store: boltdb-shipper
        object_store: s3
        schema: v11
        index:
          prefix: index_
          period: 24h
    storage_config:
      boltdb_shipper:
        active_index_directory: /data/loki/boltdb-shipper-active
        cache_location: /data/loki/boltdb-shipper-cache
        cache_ttl: 24h         # Can be increased for faster performance over longer query periods, uses more disk space
        shared_store: s3
      aws:
        # Note: use a fully qualified domain name, like localhost.
        # full example: http://loki:supersecret@localhost.:9000
        s3: http://<accessKey>:<secretKey>@<endpoint>:<port>
        bucketnames: loki-data
s3forcepathstyle: trueLoki로 직접 log push
loki service를 NodePort로 오픈하여 api 호출
curl -v -H "Content-Type: application/json" -XPOST -s "http://localhost:32265/loki/api/v1/push" --data-raw '{"streams": [{ "stream": { "job": "test/test" }, "values": [ [ "1682177993000000000", "testval" ] ] }]}'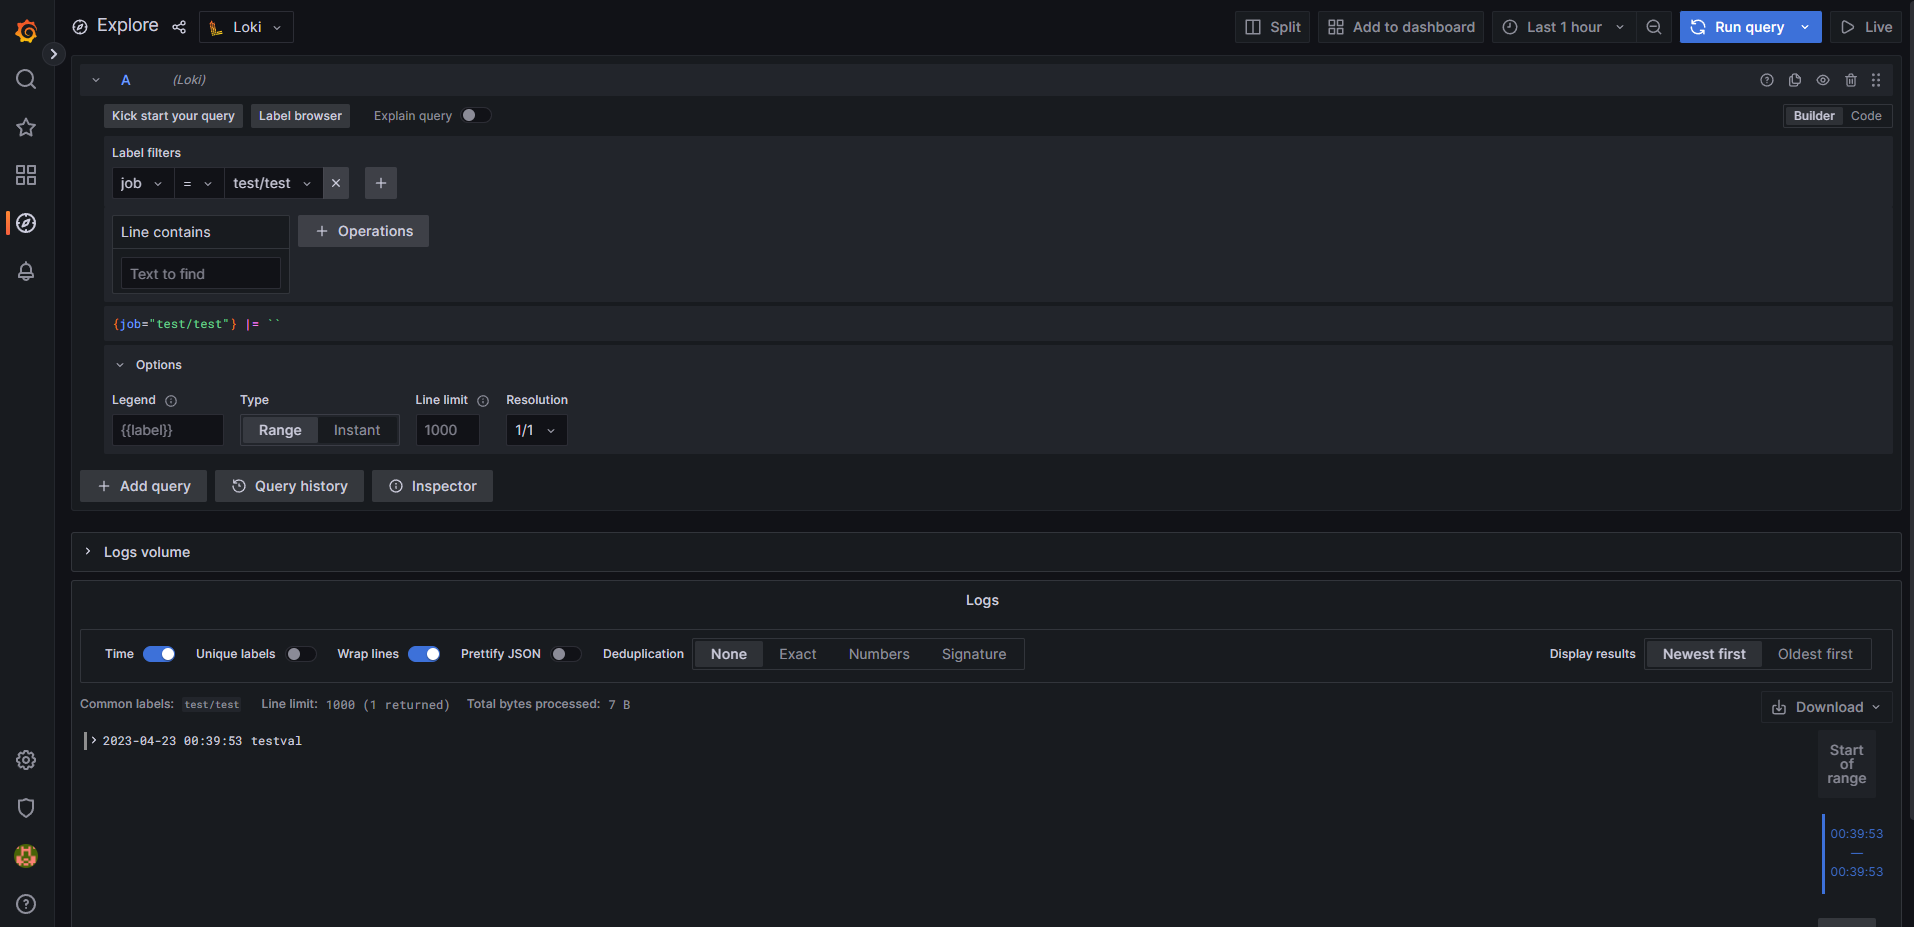
참고
K8s plg stack
https://www.thorsten-hans.com/logging-in-kubernetes-with-loki-and-plg-stack/
loki label & query
https://grafana.com/blog/2020/04/21/how-labels-in-loki-can-make-log-queries-faster-and-easier/
https://grafana.com/blog/2020/08/27/the-concise-guide-to-labels-in-loki/
grafana query (LogQL)
https://www.sobyte.net/post/2022-06/logql/
'DevOps > Kubernetes' 카테고리의 다른 글
| K3s certificate expired (0) | 2023.04.26 |
|---|---|
| [CKA] CKA 합격 후기 (2021.12 - kubernetes v1.21) (12) | 2021.12.25 |
| [CKA] CKA 자격증 준비 자료 정리 8 (Networking) (0) | 2021.12.22 |
| [CKA] CKA 자격증 준비 자료 정리 7 (Storage) (0) | 2021.12.18 |
| [CKA] CKA 자격증 준비 자료 정리 6 (Security) (0) | 2021.12.16 |